REPLICATION
CUNY WORKSHOP 2020
Louis Chauvel
This page address: http://www.louischauvel.org/Replication_cuny_2020.html
The purpose of this set of documents is the replication of important LIS
based evidence,
using the “webui”, ie the
2020 version of LIS tool “lissy”, that offers graphic
possibilities.
This supposes you dispose of a login/password that should not be a problem.
Look for Lissy access there, https://www.lisdatacenter.org/data-access/lissy/eligibility/
All the replication files are based on Stata programming.
Session 0 INTRODUCTION
http://www.louischauvel.org/Replication_cuny_2020_0.pptx
VIDEO è https://youtu.be/wdnY__Bsnpg
Very precisely, we consider Pr Janet Gornick’s intervention to the ‘Inequality by the Numbers’
Virtual Workshop 2020
(https://stonecenter.gc.cuny.edu/news-and-commentary/inequality-by-the-numbers-2020/)
Janet’s intervention titled “LIS Data: A Resource for Inequality Research”
(https://stonecenter.gc.cuny.edu/inequality-workshop-2020-lis-a-resource-for-inequality-research/
)
includes a video and slides (https://stonecenter.gc.cuny.edu/files/2020/08/Gornick-LIS-Session-2020-final.pdf)
Be aware wider analyses are on this online publication (Items: Insights from the Social Sciences, Income Inequality in Rich Countries: Examining Changes in Economic Disparities, by Janet Gornick and Nathaniel Johnson, 2020):
My aim here is to replicate (or provide a proxy replication) of graphs on several slides of the CUNY presentation, precisely slides 15 16 18/19 21 22 26. Additionally, slide 24 will be an annex since it is an aggregate of the wealth LWS and income LIS resource.
I precise I wrote 100% minus epsilon of the programs we run here on lissy, exception with LIS top and bottom codings. The original programs in Janet’s presentation were created by Nathaniel Johnson in CUNY ( https://commons.gc.cuny.edu/members/njohnson/ ). The codes I provide here are entirely mine (but LIS routine treatments on outliers), and please be free to use this for good…
For each slide, after a rapid comment on the relevance of the content, I show how a lissy-stata program may offer a replication (or a variant or sometimes a proxy that should be used again in the future to change countries and dates).
In a philosophical footnote, I would insist that this kind of exercise is useful to develop a culture of fully step-by-step replicable science that anyone can check on a common ground. We have to show what we do and do what we show
Session
1 Pre and post transfers Gini indices comparisons SLIDE 15
http://www.louischauvel.org/Replication_cuny_2020_1.pptx
VIDEO è https://youtu.be/aGYuvRh65Ag
We consider SLIDE 15 of Janet Gornick’s presentation
(https://stonecenter.gc.cuny.edu/files/2020/08/Gornick-LIS-Session-2020-final.pdf)
I quote Janet=
“Question 1 How does income inequality vary across high-income countries? (…) “pre-tax-and-transfer” (…) “Post-taxand-transfer” income inequality?” (Gornick 2020 slide 14)
The answer is on slide 15.
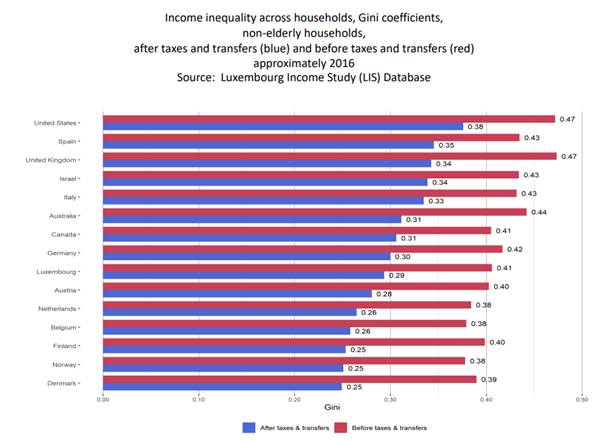
ð The U.S., Spain (ES) and the U.K. are the most unequal countries
ð Northern European countries are less
ð In general, the Gini of the equivalised disposable income after redistribution is average 0.1 lower than before
ð Northern European countries redistribute more
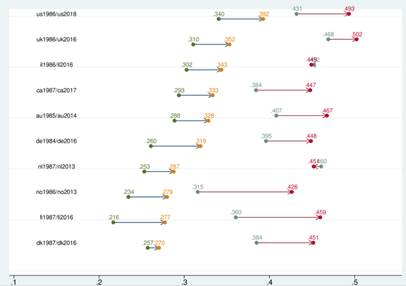
To replicate this graph, we use this Stata syntax:
http://www.louischauvel.org/slide15.txt
Results and
comments are on the ppt of this session:
http://www.louischauvel.org/Replication_cuny_2020_1.pptx
Exercise : please compare the same way Latin American countries …
Session
2 Pre and post transfers Gini indices dynamics SLIDE 16
http://www.louischauvel.org/Replication_cuny_2020_2.pptx
VIDEO è https://youtu.be/XiXwR5FTzk0
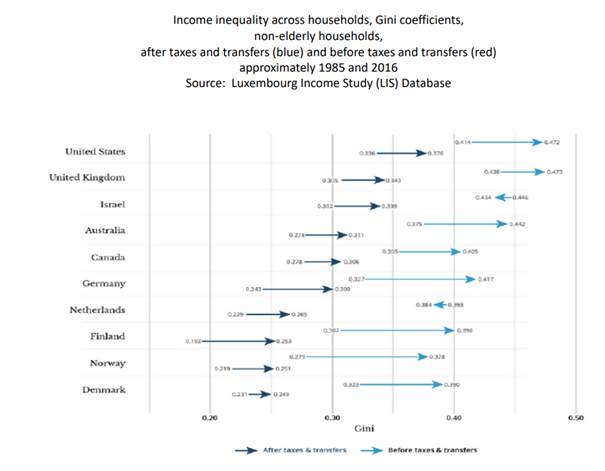
We consider SLIDE 16 of Janet Gornick’s presentation
(https://stonecenter.gc.cuny.edu/files/2020/08/Gornick-LIS-Session-2020-final.pdf)
I quote Janet=
“Question 1 Has <income inequality> increased since the 1980s in most high-income countries? Has “pre-tax-and-transfer” income inequality increased? “Post-taxand-transfer” income inequality? Both?” (Gornick 2020 slide 14)
The answer is on slide 16 (a complexification of slide 15 above) on the 1985 to recent times arrows (dark blue for disposable income inequality trend and light blue for factor income)
Different comments (and yours?)
ð Wild ride at the top of unequal countries (The U.S.)
ð Northern European countries are interesting: huge increase in factor incomes, less in disposable
ð Etc.
To replicate this graph, we use this Stata syntax:
http://www.louischauvel.org/slide16.txt (crunching time circa 7 minutes )
Results and
comments are on the ppt of this session:
http://www.louischauvel.org/Replication_cuny_2020_2.pptx
Exercise : please add to the graph Southern European countries like ES IT FR …
Then Latin American countries early 2000 to most recent …
Session
3: Countries dynamic comparisons of income classes: The middle class circa 1985
to today, SLIDES 18/19
http://www.louischauvel.org/Replication_cuny_2020_3.pptx
VIDEO è https://youtu.be/_dRev1E9UAY
We consider SLIDE 18/19 of Janet Gornick’s presentation
(https://stonecenter.gc.cuny.edu/files/2020/08/Gornick-LIS-Session-2020-final.pdf)
I quote Janet=
“We hear a lot about “the hollowing out of the middle”. During the last three decades, what exactly has taken place in the middle of the income distribution? Has the size of “the middle” shrunk?” (Gornick 2020 slide 17)
The answer is on slides 18/19 (based on the same data than slide 16 above) on the 1985 to recent times changes in the relative proportion of the poor, the affluent, and of the middle class income populations (based on equivalized disposable income: see the slides and the program)
Different comments (and yours?)
ð More affluent people than poor (why?... :)
ð The U.S. at the top … Nordic countries still have a larger income middle class
ð The trend of “shinking middle class” is well assessed
ð Changes in ranks help detect strong transformations
ð Etc.
To replicate this graph, we use this Stata syntax:
http://www.louischauvel.org/slide1819.txt (crunching time circa 7 minutes …)
Results and
comments are on the ppt of this session:
http://www.louischauvel.org/Replication_cuny_2020_2.pptx
Exercises : please add France …
Then Latin American countries early 2000 to most recent …